CityPulse: Fine-Grained Assessment of Urban Change with Street View Time Series

AAAI 2024 (Special Track on AI for Social Impact)
1Stanford Univeristy, 2University of California San Diego
*Equal Contribution

CityPulse introduces the largest street-level scene change detection dataset to date. Each street view time series in the dataset is labeled as either 'change' or 'no change' at the image level, covering a time interval of 16 years across 4 metropolitans in the United States.


As shown on the map, each red point represents a location where we sample the street view time series. In total, we collect 757 locations and retrieve their corresponding street view time series, which consist of 9,137 images. We then annotate each time series to identify the urban change points. Among them, 352 time series have been labeled with a total of 426 urban change points, while the remaining ones exhibit no substantial urban change.

Abstract

Urban transformations have profound societal impact on both individuals and communities at large. Accurately assessing these shifts is essential for understanding their underlying causes and ensuring sustainable urban planning. Traditional measurements often encounter constraints in spatial and temporal granularity, failing to capture real-time physical changes.

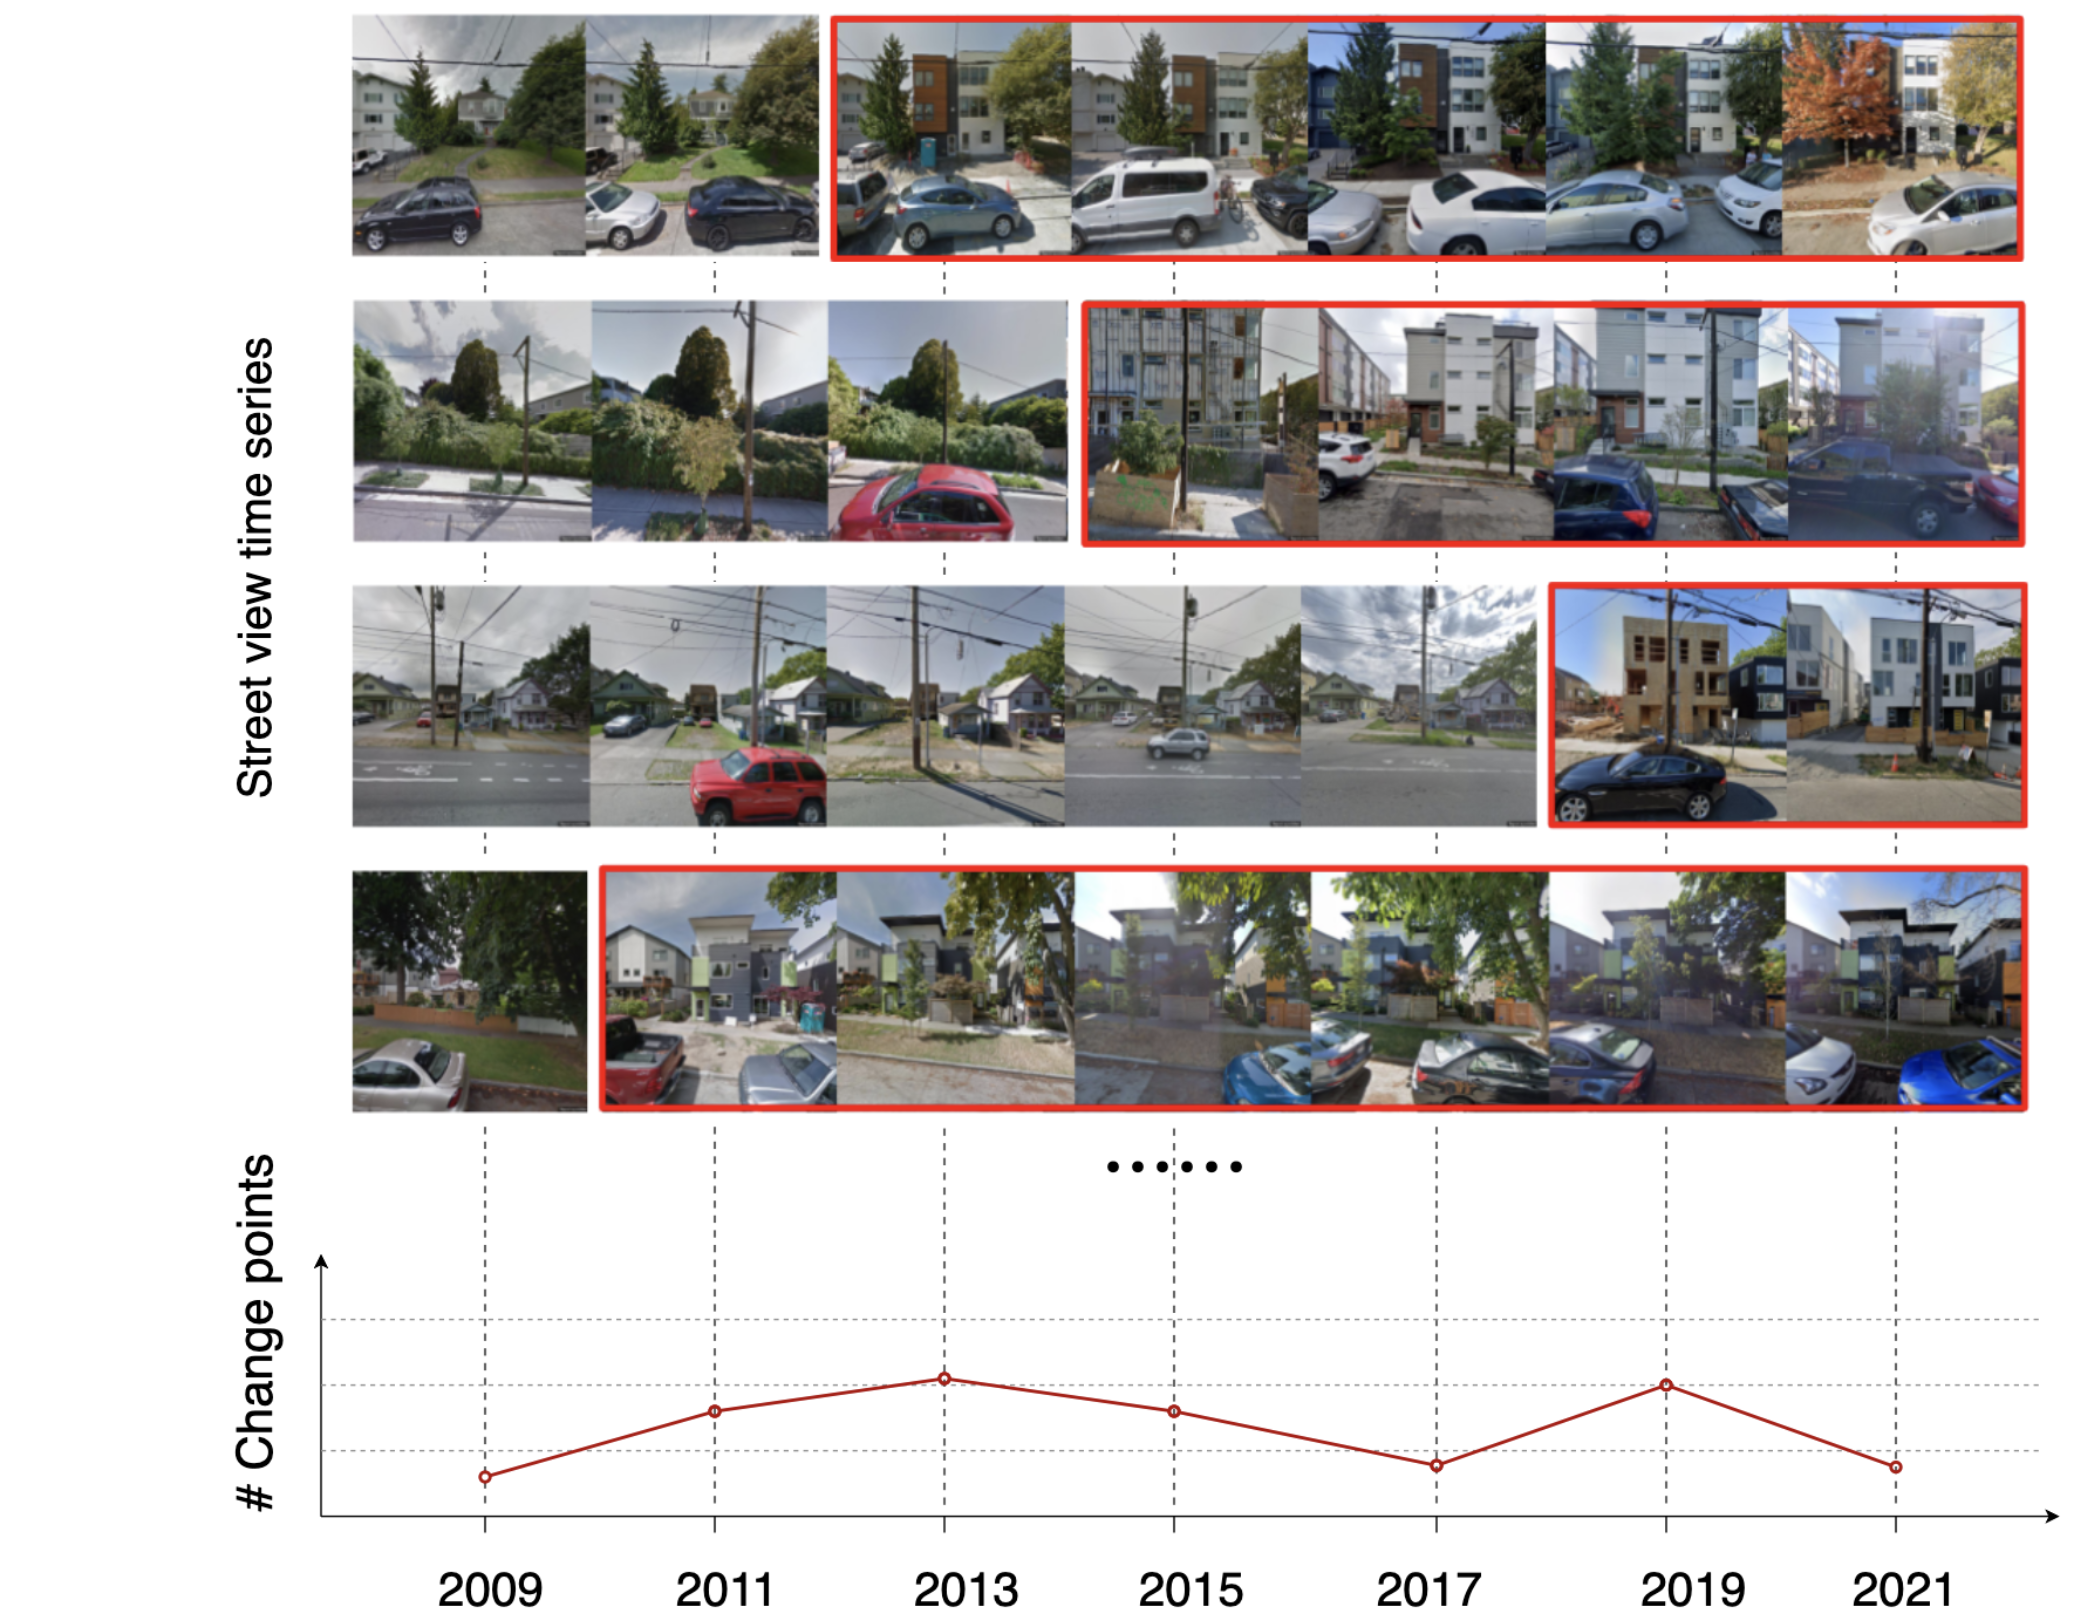
While street view imagery, capturing the heartbeat of urban spaces from a pedestrian point of view, can add as a high-definition, up-to-date, and on-the-ground visual proxy of urban change. 
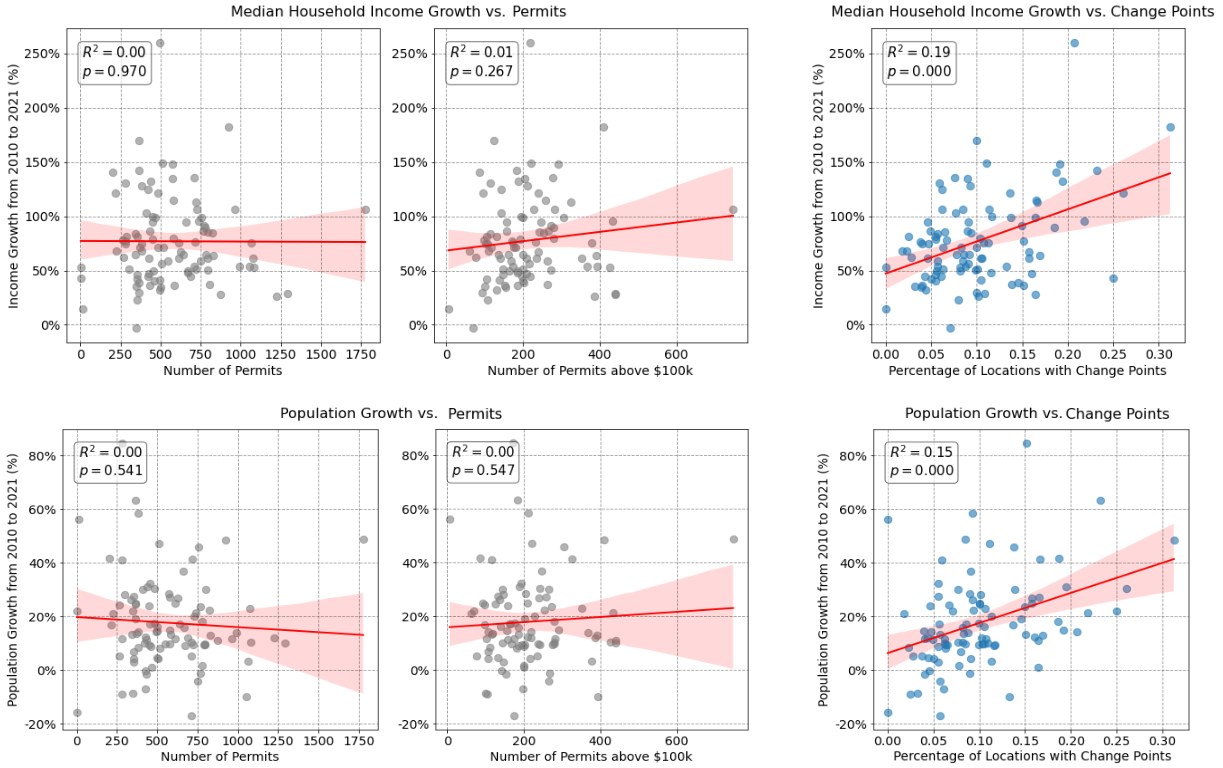
We demonstrate the effectiveness of our proposed method by benchmark comparisons with previous literature and implementing it at the city-wide level. Our approach has the potential to supplement existing dataset and serve as a fine-grained and accurate assessment of urban change.


Interpolate start reference image.

Detection of urban change points using street view time series. Red bounding boxes highlight transformations in the built environment at each location. By aggregating these detected change points within a neighborhood, we can evaluate the temporal dynamics of urban development.

Interpolate start reference image.

Linear correlation with socio-demographic indicators. Top: Median household income. Bottom: Population size. Each dot represents a Seattle census tract. The change detection results show statistically significant correlations with socio-demographic metrics, in contrast to construction permit data which lacks such correlation.

BibTeX

@article{huang2024citypulse,
      title={CityPulse: Fine-Grained Assessment of Urban Change with Street View Time Series},
      author={Huang, Tianyuan and Wu, Zejia and Wu, Jiajun and Hwang, Jackelyn and Rajagopal, Ram},
      journal={arXiv preprint arXiv:2401.01107},
      year={2024}
}